

Where practitioners stumble — and the quiet limits of current tools
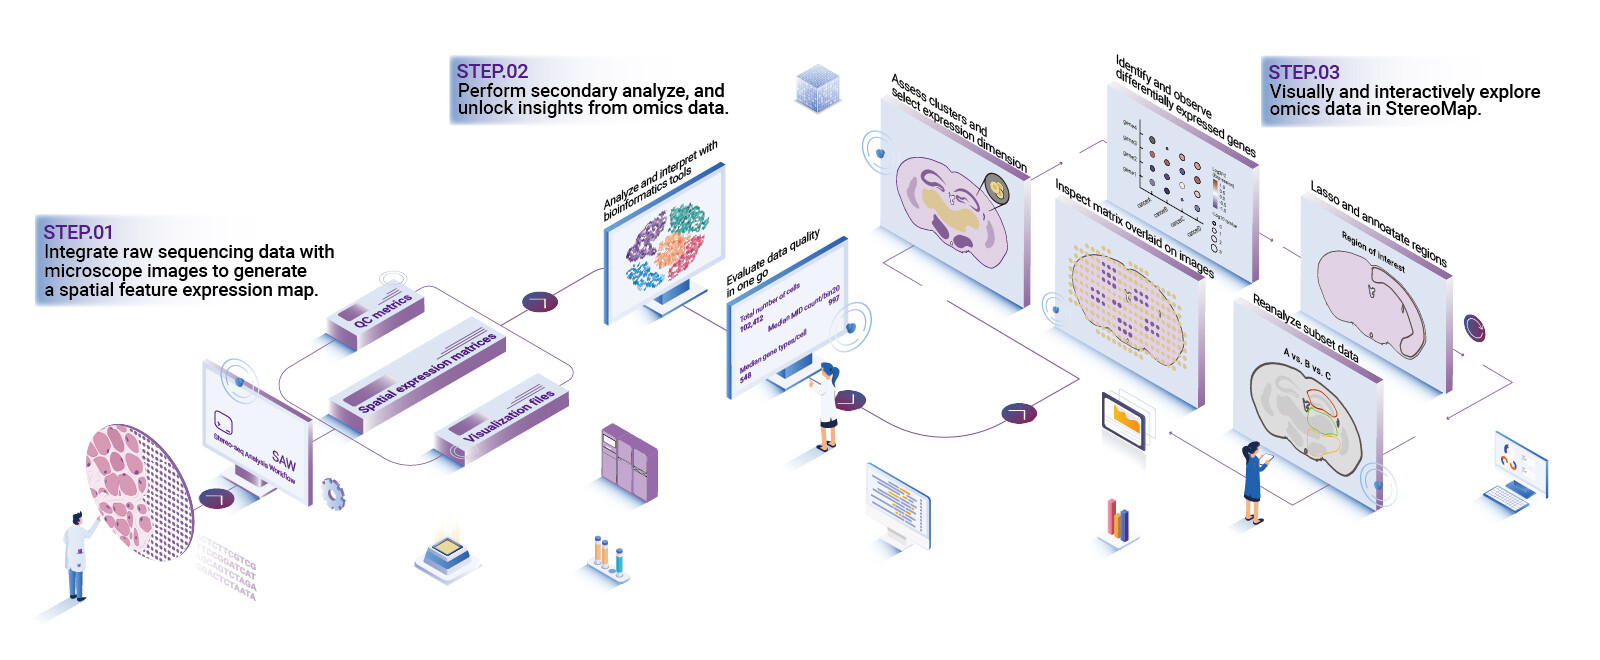
I remember a late October afternoon in a small Boston lab—2019, a 10x Visium slide on the bench—when a simple expectation went sideways and stayed that way. In one run I saw 1,200 spatial spots and only 40% yielded clean gene expression profiles—how do we recover the lost context and trust in those maps? Early on I turned to a spatial transcriptomics analysis package that promised integrated visualization and single-cell alignment, and yet the outputs felt patchy. Over years I logged the same complaints from colleagues: exports that lose spatial coordinates, cell segmentation that mixes nuclei and background, and workflows that assume you have a bioinformatician on call. These are not academic gripes — they are day-to-day bottlenecks that waste time and specimens (and money).
Why does this still happen?
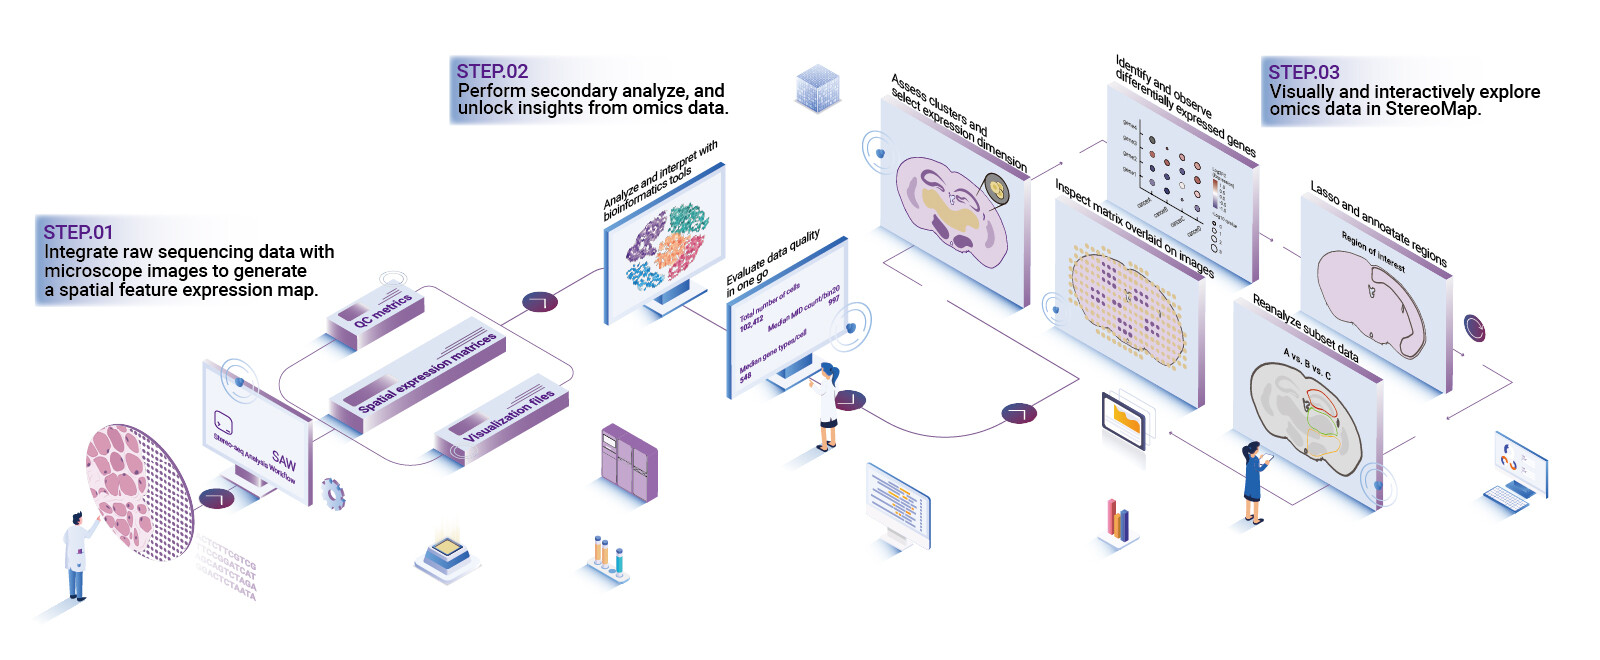
We often blame algorithms, but the gap is deeper: tooling is designed for perfect input, not the messy reality of slides with uneven staining or partial tissue folds. I’ve seen pipelines choke on tissue tears from a single frozen block (a sample taken downtown, November 2020) and produce misleading spatial mapping. The flaw isn’t always the math; it’s data handling, fragile metadata standards, and UI choices that hide error rates. Single-cell calls get optimistic scores while cell segmentation misses small neurons—shortcomings that ripple into downstream interpretation. I’ve learned to ask one practical thing first: can I trace a result back to the raw image within three clicks? If not, the tool is costing more than it saves. — And that’s the crux.
Looking forward: pragmatic improvements and what to compare
Now I shift to what I would choose today and how we measure meaning. I want software that treats spatial transcriptomics as an imaging problem plus a sequencing problem, not one shoe that tries to fit both feet. Practically, that means robust cell segmentation that accepts manual correction, transparent gene expression QC metrics, and spatial mapping layers that preserve coordinate fidelity. When I evaluate a package I reopen that Boston dataset and a hippocampus slide from 2021—two very different tissues—and I expect reproducible overlays. I also expect straightforward integration with single-cell reference atlases. It’s technical; it matters.
What’s Next?
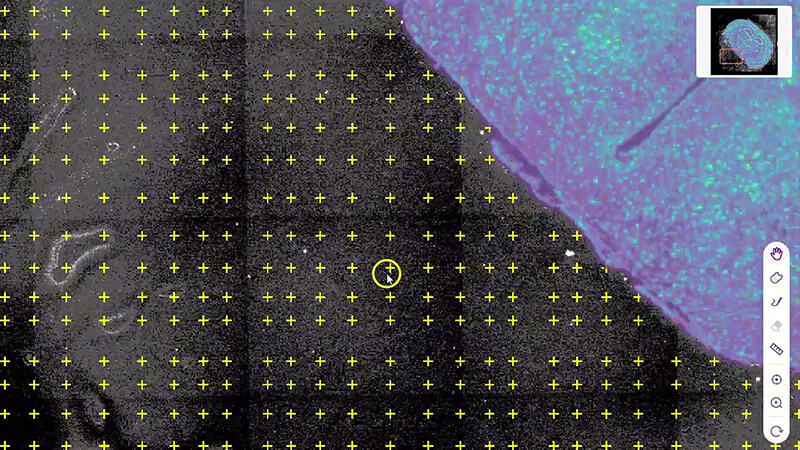
Compare tools on concrete axes: data integrity, user remediation, and reproducibility. Ask whether the spatial transcriptomics analysis package lets you re-run segmentation with small parameter tweaks, export corrected masks, and log every change. I want clear logs (yes, even audit trails), and a visualization layer that shows raw pixels, spot calls, and expression heatmaps together. It should be possible to recover from a bad staining run without re-sequencing. I stopped using products that hid intermediate files — never again. Unexpected pause. Then action.
Practical closing — three metrics I trust
I’ll leave you with three evaluation metrics I use when advising labs: 1) Traceability — can every result be linked to the raw image and timestamped processing step? 2) Remediation cost — how much hands-on time is required to fix a failed segmentation or batch effect (hours, not days)? 3) Reproducibility — do identical inputs yield identical spatial maps across runs and users? These are measurable. They expose the traditional solution flaws and the hidden pain points I’ve seen for over 15 years working with tissue imaging, sequencing runs, and lab teams in places from Boston to Barcelona. Choose tools that let you see, fix, and trust the map — and you’ll save specimens and sanity. I recommend testing with a known slide, a defined timepoint, and a simple quantifiable outcome (percent usable spots) before you commit.
For practical deployments and a platform I’ve observed in real labs, consider stomics.